When you build complex angular.js apps, your user interface might start to feel sluggish: You experience an uncomfortable delay whenever you click a button, the screen flickers when you scroll and some actions freeze your browser completely.
This guide will help you to identify and speedup the slowest parts of your app.
Hint: This post is from 2013. We’ve migrated to React in the meantime. Are you keen to work on React in Berlin? Check our our careers page!
Workflow
Then you begin worrying about your app’s performance. But wait! – Its important to focus on the right things now, because “premature optimization is the root of all evil” (Donald Knuth). Performance optimizations always bear the risk of increasing code complexity and therefore decreasing maintainability.
Therefore always optimize with this strategy: Set a time budget for each operation, analyze the app to spot major bottlenecks and optimize those one by one.
Tools
To improve your application’s performance you need tools capable of measuring your applications performance. The following section gives you a brief overview of such tools.
Chrome Developer Tools
Extremely useful, detailed insights into your application (see our previous article).
Timeline Tab
See exactly what your application does in a given timeframe. It tracks resource loading, javascript parsing, style calculation, and repainting.
It helps to identify the origin of slow, laggy and unresponsive behaviour of your application.
Batarang
Chrome plugin to debug and profile AngularJS apps. Among other useful informations, this tool helps you to measure the progress, while tuning the perfomance.
Models Tab
The models tab shows a navigable tree of the scope with the attached models.
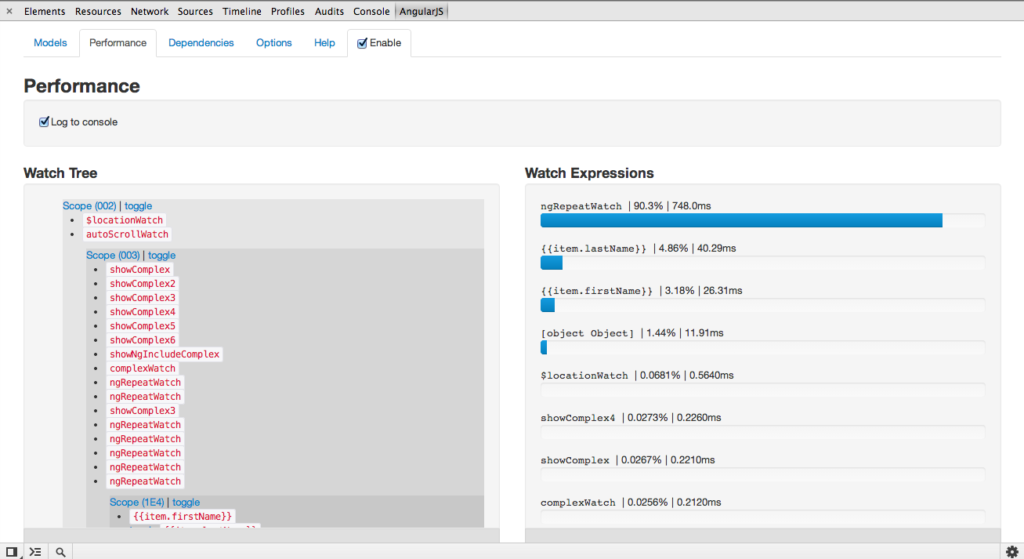
Performance Tab
This tab let’s you analyse the tree of watched expressions.
- Displays execution time for the individual watchers.
- Relative time of a watched expression: It provides a relative insight into the performance of your application’s (watch) expressions.
Helps to identify the cause of:
Watch expressions that are too complex and thus consume too much time on excecution.
Large scopes wich possibly have slower $digest() cycles.
Main Problems and their Solutions
Too many reflows / repaints / parseHTML:
Usually the browser applies style and layout changes in batches since DOM operations are expensive. Lagging is caused if by constant repainting, which appears when batching is not possible.
Possible solutions:
- Write inline templates in your directive’s template property
- Prefill angular’s build-in $templateCache with your templates. When you require an external template, AngularJS first checks the cache. There’s also a handy grunt task which automatically minifies and combines your HTML templates and prefills the AngularJS $templateCache. (https://github.com/ericclemmons/grunt-angular-templates)
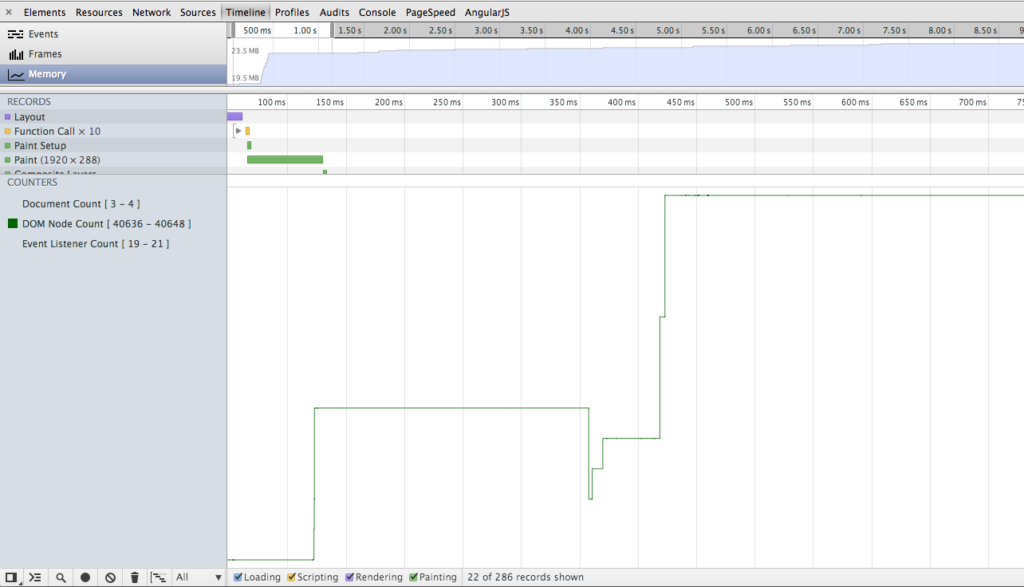
As you can see in th followinge screenshot, the “Layout” and “Recaculate Style” event is constantly trigered. A possible cause could be the use of many ng-includes in a template or the use of a directives require attribute. Also the ng-repeat directive in combination with includes and requires causes often constantly repainting

Slow dirty checking
Dirty checking consists of two things: recognizing changes and reacting to them. Recognizing changes can be slow because you either registered to many watchers or the values beeing watched are too complex. Reacting to changes can be slow because you do too much in the watch expression.
Possible solutions:
Unregister watches after use with the unregister function:
var unregisterFn = $scope.$watch(‘name’, function(){/*expr*/});

unregisterFn();
Use isolated scopes in directives and pass in only necessary models / values
Precalculate and cache complex model changes and apply them in the watch expression
Prefilter large collections and use result as source for ng-repeat
Only deep-watch if necessary. Deep-watching uses angular.equals on each property.
In the following screenshot the batarang plugin for Chrome shows that the ngRepeatWatch expression consumes 90% of the overall execution time of the entire $digest() loop.
Too many DOM operations
Using the DOM api is expensive, therefore you should work with as few DOM nodes as possible.
This screenshot shows extensive usage of DOM nodes
Possible solutions
- Use replace: true in custom directives
- Use ng-if over ng-show/ng-hide
- Use ininite scrolling or pagination for lists (with ng-repeat)
HINT: This is work in progress, more content will follow! Come back soon 😉
Additional reading:
- Mastering Web Application Development with AngularJS Chapter 11
- Repainting problem https://developers.google.com/chrome-developer-tools/docs/demos/too-much-layout/